image text translation
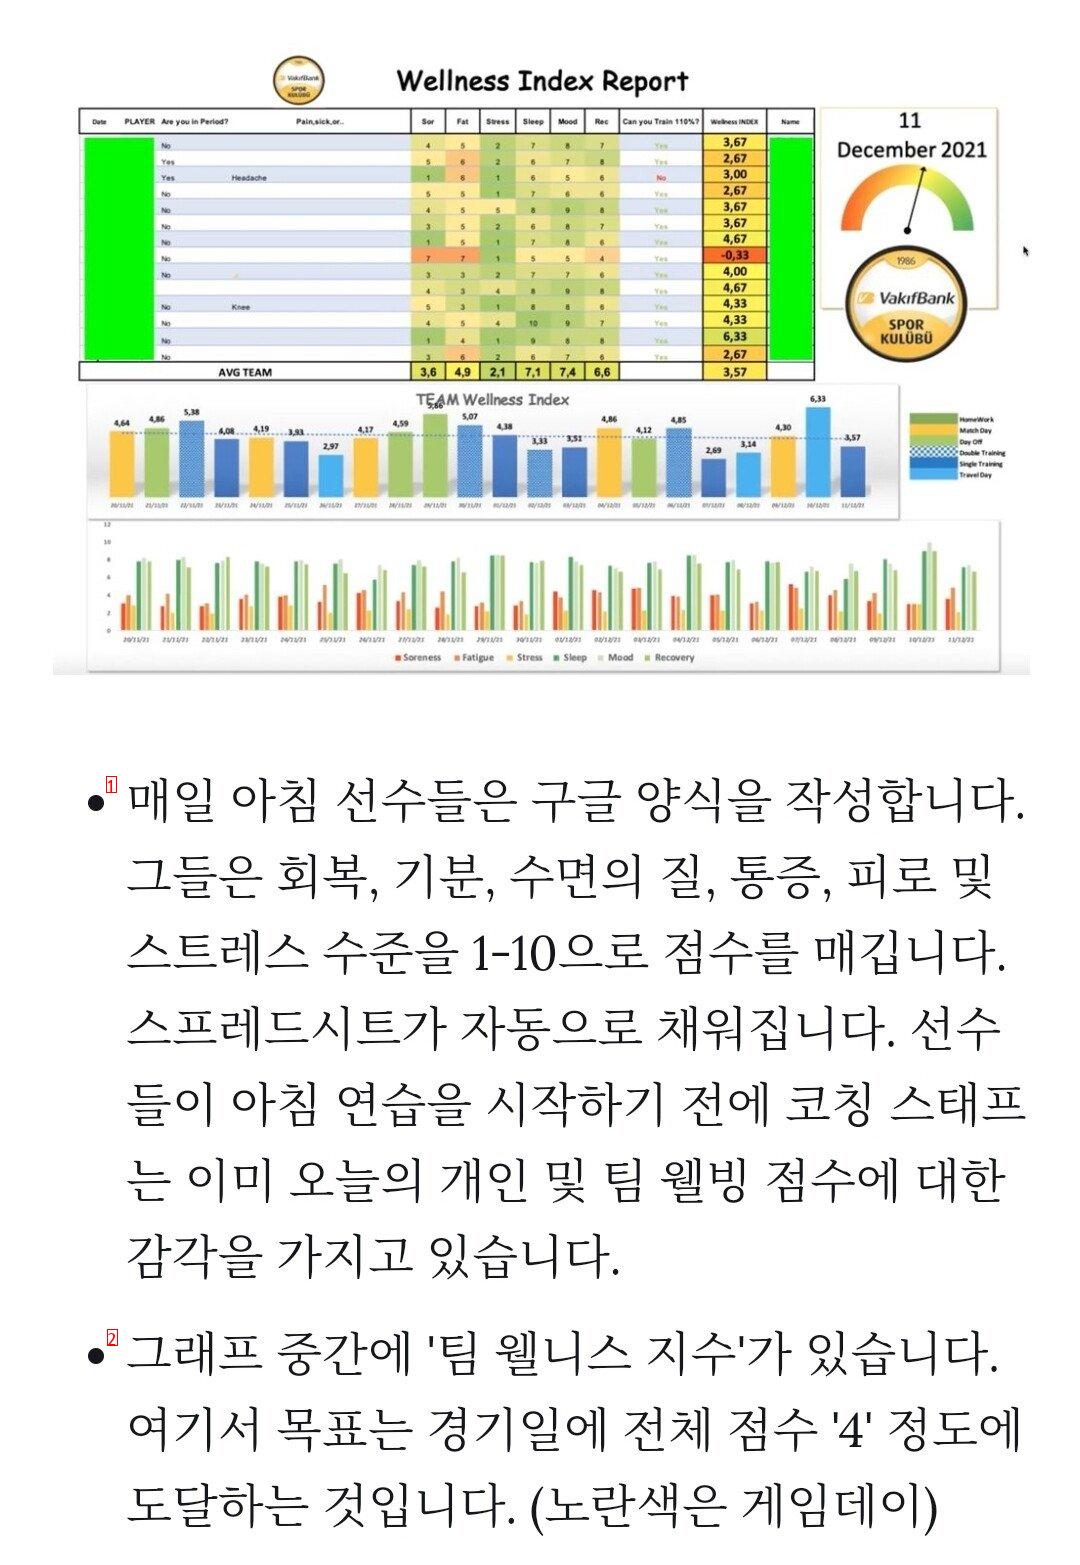
(1)Players fill out Google forms every morningThey score recovery mood, quality of sleep, pain, fatigue, and stress levels 1-10The spreadsheet fills automatically The coaching staff already has a sense of today’s individual and team wellbeing scores before the players begin their morning practice
(2)There’s a team wellness index in the middle of the graphThe goal here is to reach an overall score of about 4 on the day of the game Yellow is game day
(1)This weekly report is accompanied by general statistics
image text translation
(2)The total RPE load is also shown here This figure is calculated from the aforementioned cumulative acceleration loadIt should be noted that there are conversion units used for all activities that are not carried out in Vakifbank’s home gym Of course, only the gouge has an appropriate network to measure acceleration indicatorsIn the third row, you can see that the total RPE load is 3930, despite the fact that this athlete has performed the average number of jumps In fact, we’re talking about Surrey Vero Setter hereI won’t show you or tell you
(1)You can read the training load, training period and jump at the top of the visualized graph If you have an average number of jumps but have a high total RPE load, you can find a significant number of days At the beginning of this post, if you return to the point Vanny created and chart the changes in acceleration and deceleration, you will be closest to the actual training load output provided by the athlete and will not always correlate with the amount of jump
image text translation
(2)Chiaka’s jump from that particular training session will be shown here as a chart X-axis is training time Y is jump height I marked the event with a green ellipse From the corresponding selection tab, you can select much more option acceleration, etc
(3)● You can see the same jump as the previous slide on this last slide, but it will be charted on the court This software will be updated next season The touch height becomes accurateYou can add a standing range for any single player and now measure the touch height in proportion to your height
(4)You can filter the jump here, and the acceleration is the same Without 3D, on a court plane
(5)There’s another screen with movement
(6)Finally; acceleration and deceleration in video call with Vanny
(7)We talked about the use cases of the dataset at length
(1)And more importantly, between the two statistics of individual athletes
image text translation
(2)Difference Most of the initial insight into how to use this data came from Juventus Lab Football, where a large difference between the two statistics resulted in greater injury to the athlete
(3)If there were no pain or other injury ineffective athlete problems landing, most of the rear work on the lower body was required to reduce the difference between acceleration and deceleration statements and reduce injury
(4)Have a great day
Turkish women’s volleyball diet management

image text translation
(1)- Talking about eating. 00, you’ll get really mad if you hear that it was a Japanese name. My Italian trainer scolded the players a lot, and then I went to Starbucks and bought a cake That’s why the Italian trainer was so angry. LOL The players’ consciousness is too low
On the other hand, Korea

image text translation
(1)Sports Korea
(2)VNL’s 27th consecutive women’s volleyball glory is over, and the Paris Olympics is far from over